ReCal OIR (“Reliability Calculator for Ordinal, Interval, and Ratio data”) is an online utility that computes intercoder/interrater reliability coefficients for nominal, ordinal, interval, and ratio data judged by two or more coders. (If you need to calculate reliability for nominal data judged by two coders only, use ReCal2; for nominal data coded by three or more coders, use ReCal3. As of 5/22/17, ReCal OIR can also be used to compute coefficients for incomplete nominal datasets.) Here is a brief feature list:
- Calculates
threefour reliability coefficients:- Krippendorff’s alpha for nominal data
- Krippendorff’s alpha for ordinal data
- Krippendorff’s alpha for interval data
- Krippendorff’s alpha for ratio data
- Accepts any range of possible variable values, including decimal values and negative numbers
- Allows missing data (as of 5/22/17)
- Results should be valid for nominal, ordinal, interval, or ratio data sets coded by two or more coders (other uses are not endorsed, and accurate results are not guaranteed in any case — trust but verify!)
If you have used ReCal OIR before, you may submit your data file for calculation via the form below. If you are a first-time user, please read the documentation first. (Note: failure to format data files properly may produce incorrect results!) You should also read ReCal’s very short license agreement before use.
ReCal OIR operates under the following requirements and assumptions:
- Data should be nominal, ordinal, interval, or ratio
- Each file should represent two or more coders working on a single variable (similar to ReCal3)
- Each column should represent a single coder’s work on one variable
- Each row should represent a single unit of analysis
- All code values must be represented numerically
- Input file must be formatted properly (see below)
- All columns must contain the same number of units of analysis. If any data are missing, each cell of missing data must be represented by a single hash mark (#) (see below)
To format your data for ReCal OIR analysis, follow these instructions (which are identical to those for ReCal3 except that OIR allows decimals and negative numbers):
- Make sure that each of your code values is represented by a unique number or a hash mark (#) for missing data. E.g. 0 = absent, 1 = present, 99 = N/A. The complete list of allowed characters in your file is as follows: numeric digits, decimal points, minus signs (for negative numbers), hash marks.
- In Excel, SPSS, or another spreadsheet-like program, create a new file.
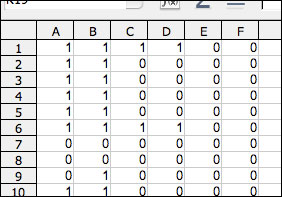
- Enter a different coder’s data into each column of your new file, one unit of analysis per row, ensuring that each row represents the same unit of analysis. Continue until each coder is represented by a single column. The screenshot below shows a file containing six coders’ output on one variable. The differences between their codes indicate that much more coder training is needed!
- Do not include any header information–the first cell of each column should be each coder’s first code.
- There should be no missing data; ReCal will generate an error otherwise.
- All data columns must contain the same number of units of analysis (i.e. all columns must end on the same row in your spreadsheet).
- Save this file in comma-Separated values (.csv), semicolon-separated values (also .csv), or tab-separated values format (.tsv). Simply changing the file extension to “.csv” or “.tsv” will not work; the file needs to be “saved” or “exported” as CSV in whatever spreadsheet or stat program you’re using. Choose “comma” as the column or field delimiter (if applicable). Click through any warning messages that may pop up. The file should have a “.csv” or “.tsv” extension. Your file is now ready for analysis; use the file selection box above to locate it on your hard drive. Before executing, be sure to check off which coefficient(s) you would like to calculate.
- Here is the full example file from which the screenshot above was taken. It contains one variable, six coders (columns) and 20 units of analysis. In a spreadsheet program it will look like a normal spreadsheet, but a web browser or text editor will display it as a series of comma-separated numbers.
- Here is a second example data file that demonstrates ReCal OIR’s ability to handle missing data. It contains ten units of analysis coded by three coders, with two cells of missing data: one at row 3 and the other at row 8.
If you’re having trouble getting ReCal OIR to work with your data, first check the FAQ/troubleshooting page, and if you don’t find the answer to your question there, send me an email. Feel free also to leave any general questions or comments regarding ReCal OIR below in comments.
I have collected ordinal data where the coding scheme ranges from 1-5. I want to compute the reliability between two coders for one variable. For example, one coder has the values: 3, 4, 1, 3. The second coder has the values: 3, 4, 1, 2. The highest code, 5, is not listed between either coder. Do all codes have to be represented to obtain an accurate alpha? Thanks!
Steve,
The math of Krippendorff’s alpha does not take account of variable values that do not actually appear in the data. In other words the fact that your variable had a possible value of 5 does not affect the final value at all; the results will be the same as if 5 was not a possible value. Hope this helps.
Yes that helps, thank you so much!
Steve
Hi. I am having a similar problem that Steve was having but I am having a hard time understanding your explanation.
The coding scheme that I am using has a point system with scale of 0-5 (6 possible outcomes per assessment). I have data for 4 independent coders but like Steve says, not all values are not present in each variable. I thought this would affect the “disagreement by chance” component of Krippendorff’s alpha and therefore increase alpha. That is, more possible outcome would reduce number of disagreement by chance since there is a lower probability of agreement had points been assigned at random.
Am I completely off? Could you please help me understand how it doesn’t affect the final value of Krippendorff’s alpha?
Thanks.
thx a lot 4 ur calculator. Searched for online and/or offline scripts (SPSS, Matlab, …), but urs was the fastest and easiest way of calculating Kripp’s alpha preventing me from writing my own script.. So thx 4 saving my time and nerves 😉
I’m having trouble understanding the value of the alpha. From what I am able to gather, an alpha closest to 1 means the most reliable, but from what I am able to tell, the number closest to 0 is the one closest to complete reliability in your program. I provided an excel file saved as a CSV and it seemed to run perfectly in the program, and I got a result of -.069. Thinking that negative was inherently bad, I wanted to make sure, so I put in a false set of coding for my 777 fields with only one aberrant answer (776 out of 777 answers were “1”, and one of them was “0”), which yielded an alpha of “0”, which is why I believe that 0 is your mark for reliability. Please let me know if my understanding is correct.
Thank you,
Chris-
Thanx Mr dfreen for providing online help for calculating reliability for content analysis. It’s really wonderful…… for calculating Krippendorff’s Alpha.
It’s a great chance for communications that such a striaghtforward tool is available – particularly as online service. Chapeau!
I am not sure, if I got the documentation right. What I have are different cases (articles) encoded by 4 coders. For the reliability test, a sample of 10% of the articles was randomly chosen and each article from this sample was assigned to another coder. For example, article 1 is encoded by A and B, article 2 is encoded by B and C, article 3 by A and C.
If I understand the documentation correct, I can only create an input file if all coders (in one file) did all of the articles. My interpretation is that I will not be able to test my data with ReCal. Did I get this correctly?
I am a little confused as to how the K’s alpha is to be interpreted. When I submitted a matrix of zeroes with a single “1” value I received a K alpha of 0, which I take as a k alpha of zero being virtually perfect intercoder reliability. When I added in more “1” values to the matrix, the k alpha jumped into a negative value (-0.07). Then, when I added in some more “1”‘s and even a couple “2”‘s, the k alpha jumped into a positive value (0.35). How is this to be interpreted? I am confused how the measure could either be positive or negative with an increase in variation between my hypothetical coders. I am sure I am doing this wrong!
Thanks
Tom
I am not sure if I understand what does it mean “multiple coders working on a single variable”. I have 25 coders who judged 18 scenes (one variable per scene) on an ordinal scale (5 values). I am interested in the interrater reliability per scene. If I create a data set of 25 coders working on a single variable, I have only one row and Krippendorf’s alpha is 0. I think I did or I understood soemthing wrong.
I’m having the same problem as Claudia – my Kripp’s alpha comes out as 0 if I upload data for a single variable & 6 coders. I was expecting the Alpha to be low because the Fleiss’ Kappa is only 0.2 but a coefficent of 0 doesn’t seem right.
Dear Prof. Freelon,
This web-based service is really useful. Thank you for developing it.
However, how can I save results history on ReCal OIR?
I’ve check in the box ‘save results history’, but there is nothing.
Thank you
Prof. Freelon
I have the same problem as Chuanpit.
Please help us, thanks
I tried to enter a hash mark (#) for a missing variable and it did not work. Not sure what I’m doing wrong?
ERROR 8: Row 10 of your file ‘Workbook1.csv’ contains a different number of codes than row 1; this usually indicates extraneous or missing data on row 1 or row 10.
this is the error message
Hi! Thanks for this tool!! I’m deciding how many coded units I’ll need based on Krippendorff’s ‘agreement and information’ article from 2011 (p. 10). The decision depends on the min alpha that one will consider acceptable, and on the level of significance. What is the level of significance used for calculating the alpha coefficients?
Thanks!
Hello,
I have 3 coders who are working on a coding scheme. There are upto 5 variables for some questions.
How do i handle the data is there is no agreement for a a particular coding image among my three coders. For instance,
coder 1 picks vairable 1, coder 2 variable 2 and coder 3 variable 3. How would I upload that data
Thank you very much! Not only is your program very useful, but also, it is very reassuring to know that some people simply help everybody the way they can.
Hey,
I have 14 Judges (Coders) which rate 30 Items on 2 different cases (vase-vignette).
I want to calculate the IRR (Krippendorffs Alpha) for each of the 30 Items on both 2 different cases together.
How to put that in the Excel-Table? Or is Krippendorffs Alpha not the right measuerement?
Thanks a lot!
Without interval estimations (confidence limits), the program has no practical significance.