ReCal3 (“Reliability Calculator for 3 or more coders”) is an online utility that computes intercoder/interrater reliability coefficients for nominal data coded by three or more coders. (Versions for 2 coders working on nominal data and for any number of coders working on ordinal, interval, and ratio data are also available.) Here is a brief feature list:
- Calculates four of the most popular reliability coefficients for multiple coders assessing nominal data: average pairwise percent agreement, Fleiss’ Kappa, average pairwise Cohen’s Kappa, and Krippendorff’s Alpha.
- Displays all possible pairwise percent agreements and Cohen’s Kappa coefficients, making it easier to root out rogue coders
- Accepts any range of possible variable values
- Results should be valid for nominal data coded by three or more coders (other uses are not endorsed, and accurate results are not guaranteed in any case — trust but verify!)
If you have used ReCal3 before, you may submit your data file for calculation via the form below. If you are a first-time user, please read the documentation first. (Note: failure to format data files properly may produce incorrect results!) You should also read ReCal’s very short license agreement before use.
- Data should be nominal
- Each file should represent multiple coders working on a single variable (note that ReCal3 can only analyze one variable at a time whereas ReCal2 can handle multiple variables simultaneously)
- Each column should represent a single coder’s work on one variable
- Each row should represent a single unit of analysis
- All codes must be represented numerically
- Input file must be formatted properly
- All columns must contain the same number of units of analysis with no missing data (see below)
To format your data for ReCal3 analysis, follow these instructions:
- Make sure that each of your content analysis code values is represented by a unique number. E.g. 0 = absent, 1 = present, 99 = N/A. Your file must contain no characters other than numeric digits—no letters, no dashes, no decimal points, only digits.
- In Excel, SPSS, or another spreadsheet-like program, create a new file.
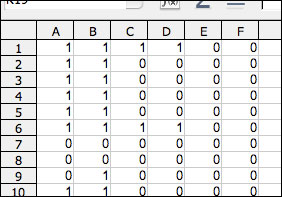
- Enter a different coder’s data into each column of your new file, one unit of analysis per row, ensuring that each row represents the same unit of analysis. Continue until each coder is represented by a single column. The screenshot below shows a file containing six coders’ output on one variable. The differences between their codes indicate that much more coder training is needed!
- Do not include any header information–the first cell of each column should be each coder’s first code.
- There should be no missing data; ReCal3 will generate an error otherwise.
- All data columns must contain the same number of units of analysis (i.e. all columns must end on the same row in your spreadsheet).
- Save this file in comma-Separated values (.csv), semicolon-separated values (also .csv), or tab-separated values format (.tsv)—simply changing the file extension to “.csv” or “.tsv” will not work; the file needs to be “saved as” CSV in whatever spreadsheet or stat program you’re using—and choose “comma” as the column or field delimiter (if applicable). Click through any warning messages that may pop up. The file should have a “.csv” or “.tsv” extension. Your file is now ready for analysis; use the file selection box above to locate it on your hard drive.
- Here is the full example file from which the screenshot above was taken. It contains one variable, six coders (columns) and 20 units of analysis. In a spreadsheet program it will look like a normal spreadsheet, but a web browser or text editor will display it as a series of comma-separated numbers.
If you’re having trouble getting ReCal3 to work with your data, first check the FAQ/troubleshooting page, and if you don’t find the answer to your question there, send me an email. Feel free also to leave any general questions or comments regarding ReCal3 below in comments.
Is there a version of ReCal3 anticipated that will perform similar analyses on ordinal and interval data, AND that will accept (the social reality of) missing data. By experience, we all know that judges can never be made to be as compliant as can computer coding.
EDIT: I have answered this question in the FAQ. ~DEEN
Does ReCal3 allow for more than one variable, the way that ReCal2 does? I.e., for 3 coders, can the first three columns represent one variable and the next three columns represent a second variable?
Julie,
It does not, and I suppose here is as good a place as any to explain why. The main reason is that I couldn’t think of an intuitive way to do it. ReCal2 simply assumes that every adjacent column pair is a new variable, but ReCal3 can’t do that since it has to be able to handle any number of coders starting with two. I briefly considered requiring users to enter the number of coders for ReCal3, which could then serve as a columnar multiple to produce that ReCal2 effect, but rejected this idea as too complicated.
ReCal’s error rate is fairly high (first-time users almost always make at least one error before completing a successful run) and I didn’t want to make the system any more complicated than it had to be. Anyone who’s ever designed a user interface will tell you that every extra hoop you force the user through generates more errors and inevitably increases attrition. I realize that my decision privileges new users at the expense of more savvy ones, but I would rather make ReCal more accessible than less, even if that means a bit more clicking for ReCal3 users. And isn’t that what undergrad coders and research assistants are for anyway?
wonderful, handy and very helpful
Is there a probability p value that is associated with Fleiss’ Kappa? If so, it would be great to see this integrated as a feature in future versions.
Thanks so much for this tool. It helped immensely. The p value would be great to include.
AWESOME!! This is so helpful!
Professor,
I don’t understand when you say “multiple coders working on a single variable”. I looks to me that each row represents a variable and columns coders. in my case i have 10 survey questions (variables) and approximately 100 respondents. Following your screenshot, I would have thought that columns represent respondents (100 columns in total) and each row a survey question (10 rows in total). Each cell then represents the answer to that respondent/question. does this make sense?
Thanks again
Guillermo
Normally intercoder reliability isn’t used to analyze survey results, unless you’re attempting to assess the extent to which your participants agree in their answers. It doesn’t make much sense to me to try to assess reliability with that many participants–you may want to check the established practice for whatever it is you’re trying to do.
Thank you professor for your quick response.
I think the tool is useful. Thanks
Wonderful tool.
If the same group of raters rate two different data sets is there a way to tell if the differences in alpha scores from one data set from another is significant?
Yes, for this I would use the z-test for equality/difference of proportions (and then use a z-to-p table or calculator). See https://explorable.com/z-test
Hi!
I’ve been trying to calculate Krippendorf’s alpha for a binary data set of 7 coders and 34 analysis units.
Since the average pairwise percent agreement is 92.717 (obtained through ReCal3), i was hoping that Krippendorf’s alpha would be high too. I’m afraid that’s not the case: Krippendorf’s alpha is equal to 0.099
I have tried to calculate alpha with different programs and the result is not so different ¿Why the alpha is so low?
Thanks!
(Nice and useful utility, by the way)
Already found “From the mailbag”
http://dfreelon.org/2009/12/14/from-the-mailbag-121409/
Thanks!
Very helpful, thanks!
Hi,
Does anyone know if one can do an average of a set of calculated Krippendorff’s Alphas? Can this value be valid to report in journals?
If so, is it sufficient by adding the value of all of the coefficients divided by the number of coefficients?
For example:
.554
.576
.430
Average = 1.56/3 = 0.52
Purpose: We calculated the KAlphas of several independent variables and we wish to know if the average of all of these variables is above .667.
Thank you.
Thank you so much for this resource!
Please could you tell me how I reference this page in my thesis?
Thanks
Gideon
I would be interested to know the same.
Dear sir,
I am not certain if I understand correctly on the “multiple coders working on a single variable”.
I have 5 coders coded for 10 participants, each participant responded 18 questions. Is it right for me to use this tool?
Thanks in advance.
Thank you for sharing this valuable research tool!
Dear
thanks for this resource. I am wondering if I can use it for evaluating the content validity of an instrument. I have 10 raters in the first round and 6 for the second round. I have utilized 5-point Likert scale.
I have used this website, but the fliess kappa and the alpha were negative while the percentage of agreement was high. HOW CAN I QUANTIFY THE INTER-RATER AGREEMENT FOR MY DATA
THANKS
thanks
How can we know the 95% CI of Krippendorf’s alpha results?
Professor,
i got the result data and confused about “fleiss’ kappa” and “average pairwise cohen’s kappa”?
how different these two number? thank u.
Really interesting calculator!
But if I wanted to calculate reliability for more coders and more than two variables for coders, is it possible?
Thank you
I have 424 data and 3 judges categorized this data. Nearly 30 data are coded in more than 1 category by some judges. What should I do? Is there a way to measure interrater reliability in this way or should I tell judges to force the data to fit into only one category.
Thanks in advance
very helpful for first time users. I was trying different online kappa calculators but data entry is too complicated in those. Instructions are clear for this recal3 calculator and output is understandable.
Thanks